
Neste post vamos aprender como interagir com o mapa, e adicionar feições a ele. Nesta nova versão do OL3, os recursos de interação podem ser encontrados na classe ol.interaction.Draw.
Vamos começar com o exemplo abaixo. Aba seu arquivo map.html em seu editor de texto e certifique-se de que fique parecido com ele:
<!doctype html>
<html lang="en">
  <head>
    <link rel="stylesheet" href="ol3/ol.css" type="text/css">
    <style>
    #map {
      height: 256px;
      width: 512px;
    }
    </style>
    <script src="ol3/ol.js" type="text/javascript"></script>
    <title>OpenLayers 3 example</title>
  </head>
  <body>
    <h1>My Map</h1>
    <div id="map"></div>
    <script type="text/javascript">
      var source = new ol.source.GeoJSON({
        url: 'data/layers/7day-M2.5.json'
      });
      var draw = new ol.interaction.Draw({
        source: source,
        type: 'Point'
      });
      var map = new ol.Map({
        interactions: ol.interaction.defaults().extend([draw]),
        target: 'map',
        layers: [
          new ol.layer.Tile({
            title: "Global Imagery",
            source: new ol.source.TileWMS({
              url: 'http://maps.opengeo.org/geowebcache/service/wms',
              params: {LAYERS: 'bluemarble', VERSION: '1.1.1'}
            })
          }),
          new ol.layer.Vector({
            title: 'Earthquakes',
            source: source,
            style: new ol.style.Style({
              image: new ol.style.Circle({
                radius: 5,
                fill: new ol.style.Fill({
                  color: '#0000FF'
                }),
                stroke: new ol.style.Stroke({
                  color: '#000000'
                })
              })
            })
          })
        ],
        view: new ol.View({
          projection: 'EPSG:4326',
          center: [0, 0],
          zoom: 1
        })
      });
    </script>
  </body>
</html>
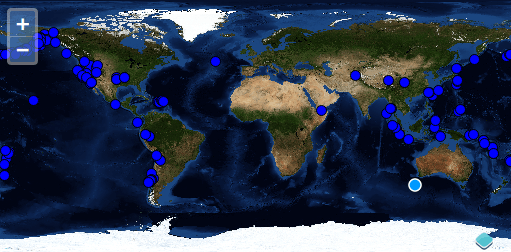
Salve as alterações e abra a página no seu navegador: @servidor@/map.html. Para ver a funcionalidade de desenho em ação, clique no mapa para adicionar um novo recurso:
Para realizar as modificações nas características das geometrias, devemos utilizar a classe ol.interaction.Select juntamenter a classe ol.interaction.Modify. Elas compartilham um conjunto comum (ol.Collection) de recursos. Os recursos selecionados através da classe ol.interaction.Select se tornam candidatos a modificações pela classe ol.interaction.Modify.
Agora abra seu arquivo map.html e realize as alterações de acordo com o código abaixo:
<!doctype html>
<html lang="en">
  <head>
    <link rel="stylesheet" href="ol3/ol.css" type="text/css">
    <style>
    #map {
      height: 256px;
      width: 512px;
    }
    </style>
    <script src="ol3/ol.js" type="text/javascript"></script>
    <title>OpenLayers 3 example</title>
  </head>
  <body>
    <h1>My Map</h1>
    <div id="map"></div>
    <script type="text/javascript">
      var source = new ol.source.GeoJSON({
        url: 'data/layers/7day-M2.5.json'
      });
      var style = new ol.style.Style({
        image: new ol.style.Circle({
          radius: 7,
            fill: new ol.style.Fill({
            color: [0, 153, 255, 1]
          }),
          stroke: new ol.style.Stroke({
            color: [255, 255, 255, 0.75],
            width: 1.5
          })
        }),
        zIndex: 100000
      });
      var select = new ol.interaction.Select({style: style});
      var modify = new ol.interaction.Modify({
        features: select.getFeatures()
      });
      var map = new ol.Map({
        interactions: ol.interaction.defaults().extend([select, modify]),
        target: 'map',
        layers: [
          new ol.layer.Tile({
            title: "Global Imagery",
            source: new ol.source.TileWMS({
              url: 'http://maps.opengeo.org/geowebcache/service/wms',
              params: {LAYERS: 'bluemarble', VERSION: '1.1.1'}
            })
          }),
          new ol.layer.Vector({
            title: 'Earthquakes',
            source: source,
            style: new ol.style.Style({
              image: new ol.style.Circle({
                radius: 5,
                fill: new ol.style.Fill({
                  color: '#0000FF'
                }),
                stroke: new ol.style.Stroke({
                  color: '#000000'
                })
              })
            })
          })
        ],
        view: new ol.View({
          projection: 'EPSG:4326',
          center: [0, 0],
          zoom: 1
        })
      });
    </script>
  </body>
</html>
Salve as alterações no seu arquivo map.html e abra a página no seu navegador. Para ver o recurso em ação, use o clique do mouse para selecionar um tremor de terra e arraste para mover o ponto.
No próximo post vamos apresentar como você pode criar o estilo da sua camada diretamente pelo OpenLayers, através de javascript.